
The Freehold vs ST shuffle | Homeowners are choosing SA's most desirable locations
Category News
Despite the uncertainties surrounding Covid-19 and the ensuing lockdowns, the residential property market has proven to be one of South Africa's more resilient sectors, despite the challenging trading environment.
If you can live and work anywhere, it makes sense to live somewhere with a better quality of life in a more desirable location.

With a population of predominantly 'young' buyers, many of whom are likely to prefer life in a city hub, the increasing demand for accommodation to buy is helping drive activity in the residential property market, filtering upwards across all sectors of the market, boosting activity in middle markets and higher price bands as some existing homeowners upscale, and even creating stock shortages in high-demand areas.
Affordability in peripheral suburbs due to WFH flexibility
While the unexpected strength in the housing market last year was catalysed by first-time buyers responding to the aggressive interest rate cuts, in 2021 the national housing market was driven by a second wave of demand - fuelled by non- first timer buyers (repeat buyers) buyers as first-time buyers felt the impact of the weak economy and the benefits of the rate cuts began to fade.
These repeat buyers were motivated by the interest rate cuts, but also by the ability to relocate due to the option to work from home and the desire for a larger home and/or more relaxed lifestyle in a more affordable home in the peripheral suburbs of the metro areas and smaller towns traditionally considered retirement or holiday destinations - resulting in a so-called Zoom Boom. This convergence of factors resulted in an unexpected surge in residential market transactions, despite the severe economic disruptions caused by the pandemic.
This desire to relocate was partly in response to lockdown, which made a larger house a necessity due to work-from-home (WFH) and home schooling, and outdoor space in particular more appealing. The ability to WFH made it feasible to consider suburbs and towns that had previously been too far from schools and the workplace, but which typically allowed homeowners to buy larger, more affordable freehold homes, which in turn saw a temporary pause in the long-term structural shift in the national housing market towards sectional title homes.
Six-month sales record hits 5-year high
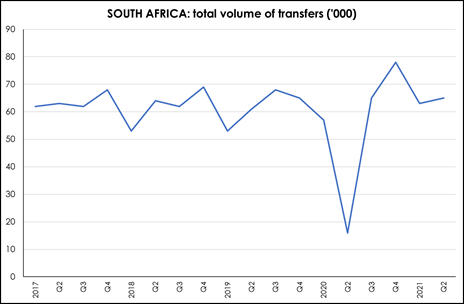
Positively, the residential property market remained robust during the first half of 2021 - both in terms of price growth and activity levels. The total number of sales recorded during the first half of the year - approximately 128 000 units - is the highest sales number recorded during the first six months of the year over the past five years. This shows surprising resilience in the national housing market, despite the economy struggling to recovery from the worst recession in a century.

| South Africa | H1 2019 | H1 2021 | % Change |
|
Units ('000) |
114 |
128 |
+12.3 |
|
Value (R bn) |
113 |
153 |
+35.4 |
(Source: Lightstone)
Much of this demand has been driven by local buyers who have identified specific areas of interest and understand the current market.
International buyer sales remain steady
Sales to international buyers have surprisingly remained steady over the past two years and during the past 12-18 months we've also seen a resurgence in demand, with sales concluded to a wide range of purchasers from the UK, Zimbabwe, Germany, USA, Botswana, Netherlands, Nigeria, Switzerland, France, British Virgin Islands among others globally - including from the rest of the African continent.
In regard to house price inflation, after averaging 5.1% from Jan-Oct 2021, it appears likely that this will average closer to 3% in 2022. While the Reserve Bank has adopted a contained and very conservative approach to the raising of interest rates with a recent 25bps increase as a pre-emptive move rather than play catch-up later, we do not believe that the fundamental reasons for purchasing property will change, including first-time buyers wanting to gain a foothold on the property ownership ladder.
Year-end market lag expected as economy slows down
Unsurprisingly, both house price inflation and activity levels are slowing as 2021 draws to an end, as the economy has lost some momentum with the return of loadshedding and the distraction of the local elections is coupled with the fuel and utility price hikes and a weaker rand, with household incomes under pressure.
Although the emergence in recent weeks of a new Covid variant - Omicron - is likely to further dampen economic activity, early indications suggest that it may not cause significant hospitalisations and deaths which could minimise the severity of the coming lockdowns, reducing the likely disruptions to an already subdued economic outlook.
One of the key factors in the surprising strength in the housing market over the past two years has been the aggressive interest rate cuts. But it is also important to note that the recent 25bps rate hike will not represent a noticeable tightening in monetary policy - and further tightening is likely to be slow - so this may not boost demand but equally is unlikely to dampen demand significantly either.
Regional Performance sees Western Cape showing accelerated growth
Regionally, KwaZulu-Natal initially led the recovery in house price inflation, being the first major regional housing market to rebound in mid-2019, followed by Gauteng. KZN was then the first to peak - again followed by Gauteng, while the Western Cape was the last to begin recovering and is still showing accelerating growth.
|
2020 |
2021 ytd |
Oct'21 |
|
|
Gauteng |
2.84 |
4.52 |
4.21 |
|
Western Cape |
4.26 |
6.06 |
6.59 |
|
KwaZulu-Natal |
4.01 |
4.95 |
4.15 |
|
National |
3.71 |
5.07 |
4.72 |
(Source: Pam Golding Residential Property Index)

Over the past almost 11 years, the percentage of national sales registered in Gauteng has inched upwards from 40% in 2010 to 41% in 2021 YTD, essentially remaining stable, while the Western Cape has seen an increase from 22.4% of all national sales in 2010 to 25.8% of all sales in 2021 YTD, says Golding.
The impact of semigration is visible between 2014 and 2017, when a rising share of total units sold were located in the Western Cape. A second wave of semigration, triggered by the global pandemic and the resultant Zoom Boom, is visible from mid-2020 until mid-2021 (latest available data).

The above four provinces account for a growing percentage of total SA unit sales - rising from 81.9% in 2010 to 84.8% in 2021 YTD. This reflects the rapid urbanisation in South Africa, which is seeing young people relocate to the economic hubs of the country which are located in these provinces.
|
Region |
% SA sales 2010 |
% SA sales 2021 ytd |
|
Gauteng |
40.0 |
41.0 |
|
Western Cape |
22.4 |
25.8 |
|
KwaZulu-Natal |
13.3 |
10.3 |
|
6.2 |
7.6 |
|
|
Four largest provinces |
81.9 |
84.8 |
(Source: Lightstone)

Nelson Mandela Bay remains top performing metro
The top performing metro market is Nelson Mandela Bay (NMB), where house price inflation has been outperforming all metro markets except Cape Town since mid-2019 - perhaps due to ongoing semigration to the coast - and subsequently outperformed relative to Cape Town since January 2020.
However, from a major metro perspective, while Johannesburg and Tshwane initially led the recovery in prices, these appear to be approaching a peak (as does eThekwini) while Cape Town - the last to recover (reaching a lower turning point about a year after the others) is now the only major metro market to be enjoying continued accelerated growth in house prices. These trends continued into July 2021 (latest data below).

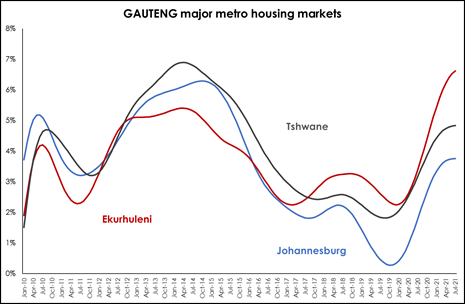
Within Gauteng, Ekuruhleni is showing the strongest performance, with price inflation accelerating to 6.6% in July, while price growth in both Johannesburg and Tshwane appears to be peaking. Price growth in Ekuruhleni has been faster than in the other two sub-regions since mid-2020, perhaps benefitting from an influx of new buyers because the metro housing market offers more affordable homes and/or more space amidst a desire for freehold homes or larger apartments for work from home.
|
Metro HPI |
2020 (ave %) |
2021 (ytd %) |
|
Nelson Mandela Bay |
+ 6.7 |
+ 7.6 |
|
Ekuruhleni |
+ 3.4 |
+ 6.1 |
|
eThekwini |
+ 3.6 |
+ 5.2 |
|
Tshwane |
+ 3.1 |
+ 4.7 |
|
Cape Town |
+ 3.0 |
+ 4.3 |
|
Joburg |
+ 1.7 |
+ 3.6 |
(Source: Lightstone)

In terms of units sold, while Cape Town was hardest hit in 2020, it has unsurprisingly recorded the strongest recovery in unit sales to date in 2021 compared to 2020 in total, while Port Elizabeth has registered the second largest rebound this year, despite registering one of the smaller declines in sales last year. Only Johannesburg and Durban sales have not yet matched or exceeded the activity levels recorded in 2020.
Among the major metro markets, Tshwane has registered by far the largest number of sales thus far this year. Of the 44 857 sales registered to date in these six metro markets, more than a third (38.1%) was recorded in Tshwane. Cape Town followed with the second largest number (25.5%) while Johannesburg has registered 22.8%. In Pretoria, well-priced homes that offer value continue to sell within six weeks, while it is encouraging to see that the buy-to-let market is picking up.
Coastal premium has widened steadily
Since early 2015, homes within 5km of the coastline have enjoyed stronger price growth than non-coastal homes (further than 5km from the coastline), except for a brief period between September 2019 and July 2020. Since then, the so-called coastal premium has widened steadily and currently stands at +1.6% In July 2021 (latest available data).
The coastal price premium may be attributable to the general shift towards coastal areas as part of the semigration trend and the Zoom Boom, and the limited availability of homes in coastal areas for geographic reasons - as there is only so much space within 500m of the shoreline - making it more likely that prices will rise relative to areas where there is more space for new homes.

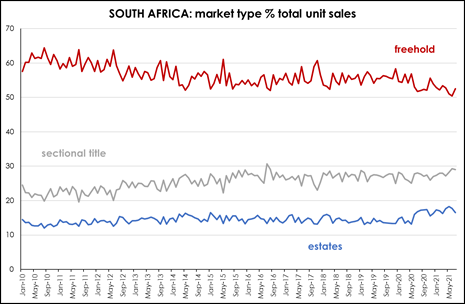
Freehold outperforms sectional title
Freehold house prices have typically enjoyed stronger growth than sectional title homes by a fairly consistent margin in recent years. However, during lockdown, growth in freehold home prices accelerated strongly relative to sectional title homes - possible reflecting the impact of the pandemic and lockdown, which prompted homebuyers to seek more space, outdoor space and, in many cases, relocate to peripheral or outlying suburbs and holiday/retirement towns where homes were more affordable - allowing them to exchange a small, sectional title home close to town for a larger, freehold home further away. However, as life returns to some semblance of normality and as people begin to return to the office, growth in freehold prices has peaked and begun to slow while sectional title price inflation has remained fairly steady.

South Africans looking for upgrade homes
When looking at freehold and sectional title homes by size, all categories are now showing a slowdown in house price inflation. However, during the course of last year and during the year to date (data available until October 2021), smaller freehold homes have experienced the strongest growth in prices, followed by three-bedroom freehold. In contrast, larger (three-bedroom) sectional title homes have registered stronger price growth than smaller sectional title homes.
This would seem to suggest that buyers who would typically have lived in a sectional title home have taken advantage of the lower interest rates and the ability to work from home to buy a more affordable freehold home away from major urban centres, resulting in increased demand for smaller freehold homes. For those still purchasing a sectional title home, which no doubt includes a large number of first-time / young home owners who have found themselves able to afford to purchase rather than rent, these have opted for slightly larger sectional title homes because they are now working from home and/or spending more time at home due to the pandemic and need more space.

Ongoing urbanisation of SA's predominantly young population
However, we anticipate that many of the trends triggered by the pandemic will gradually begin to fade and/or reverse over the course of 2022 and beyond. For example, we experienced a temporary halt in the long-term structural shift in housing stock from predominantly freehold to predominantly sectional title - reflecting the ongoing urbanisation of SA's predominantly young population.

In 2011, just 30.3% of all homes sold in Cape Town were sectional title. By 2021, this had risen to 38.5%. In Johannesburg, the shift was from 42.2% in 2011 to 41.8% in 2021, reflecting essentially no change, although the underlying trend line shows a slow steady rise. In 2011, more than half of all home sold in Pretoria were sectional title - a percentage that has risen from 53.9% in 2011 to 60.1% thus far this year.
|
ST % total sales |
2011 |
2021 YTD |
|
Johannesburg |
42.2 |
41.8 |
|
Cape Town |
30.3 |
38.5 |
|
Durban |
49.3 |
57.9 |
|
Pretoria |
53.9 |
60.1 |
|
38.3 |
50.5 |
(Source: Lightstone)
Notably, 2021 is the first year in which sectional title sales have accounted for more than half of total sales in Gqeberha. In Durban, the last time sectional title sales were less than 50% of all sales in a single year was 2011.

Among the major metro housing markets, Pretoria has the highest percentage of sectional title sales. In all five metro markets the underlying trend is upward, as one would expect given the young population, rapid urbanisation and the shift in lifestyles towards lock-up-and go and mixed-use precincts.
Author: Koalet Properties